50 lines
2.7 KiB
Markdown
50 lines
2.7 KiB
Markdown
# Graphs for the coach extension to openrowingmonitor
|
|
|
|
## [quiske](https://play.google.com/store/apps/details?id=com.quiske.rowingperformance&hl=en)
|
|
|
|
[Screens](https://www.rowingperformance.com/blog/quiske-coach-knows-dynamic-too)
|
|
|
|
* 
|
|
* 
|
|
* 
|
|
* 
|
|
* 
|
|
* 
|
|
* 
|
|
* 
|
|
* 
|
|
* 
|
|
|
|
## rowing in motion
|
|
|
|
### [App Metrics](https://www.rowinginmotion.com/app/metrics)
|
|
|
|
#### Stoke Effiency
|
|
|
|
The area under the speed graph.
|
|
|
|
#### Catch Duration
|
|
|
|
The time the boat is decelerating at the catch (sec)
|
|
|
|
#### Catch Efficiency
|
|
|
|
The slope between the point of maximum negative acceleration and the point
|
|
where zero acceleration was first hit.
|
|
|
|
#### Check Factor
|
|
|
|
The difference between maximum and minimum boat velocity.
|
|
|
|
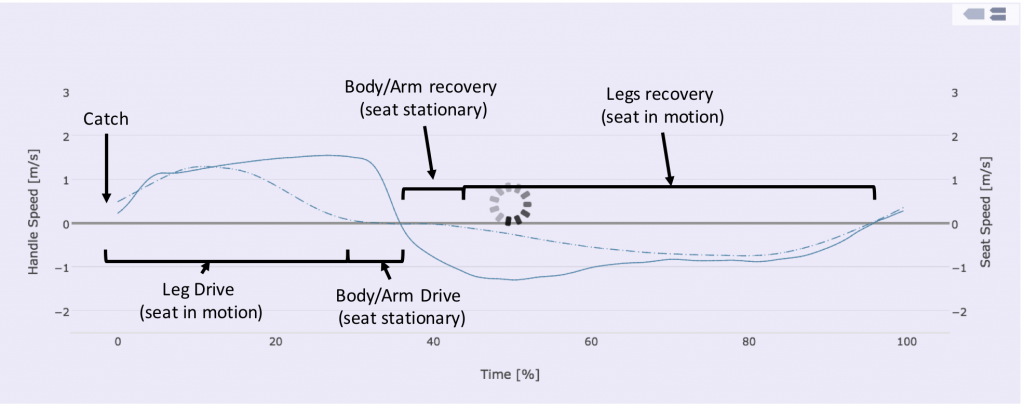
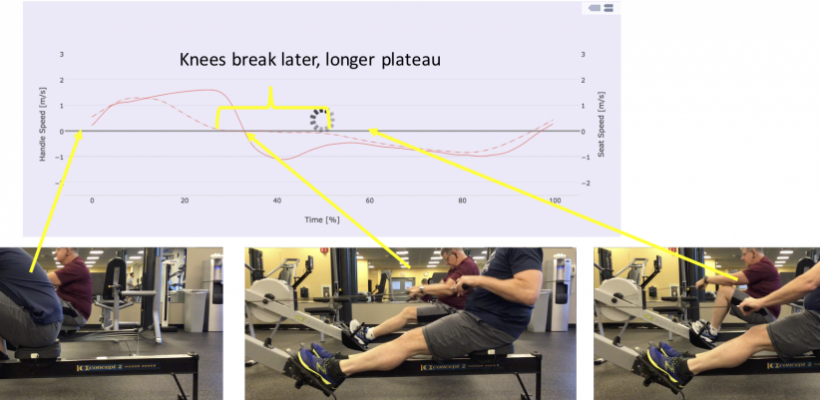
### [stroke analysis](https://docs.rowinginmotion.com/en/analytics-typical-stoke.html)
|
|
|
|
* 
|
|
* 
|
|
|
|
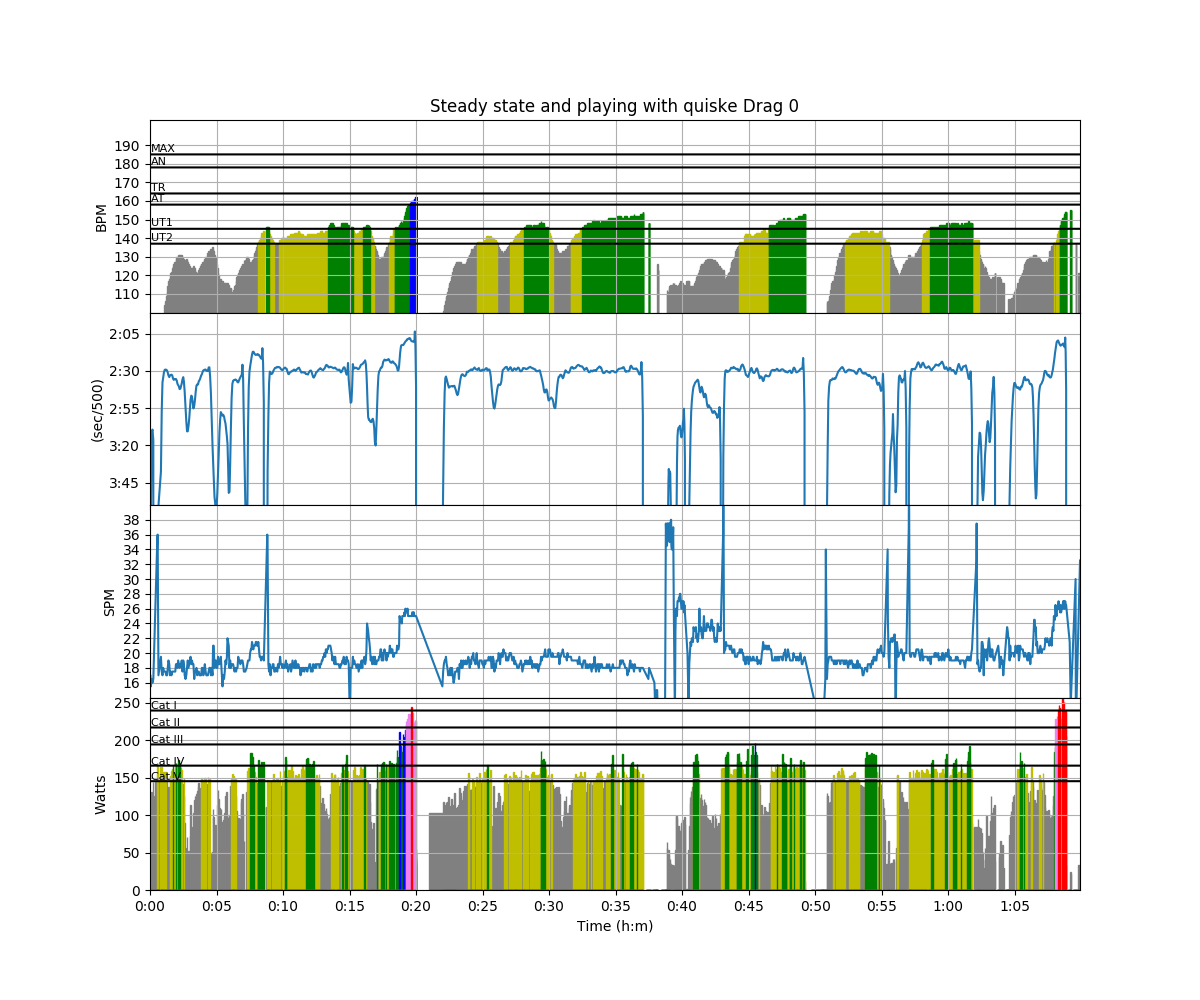
### [intensity analysis](https://docs.rowinginmotion.com/en/analytics-intensity.html)
|
|
|
|
Intensity histogram donut showing the proportion of each intensity zone to all
|
|
other intensity zones in a logfile based on either stroke-rate or heart-rate.
|
|
|
|
* 
|