2.8 KiB
2.8 KiB
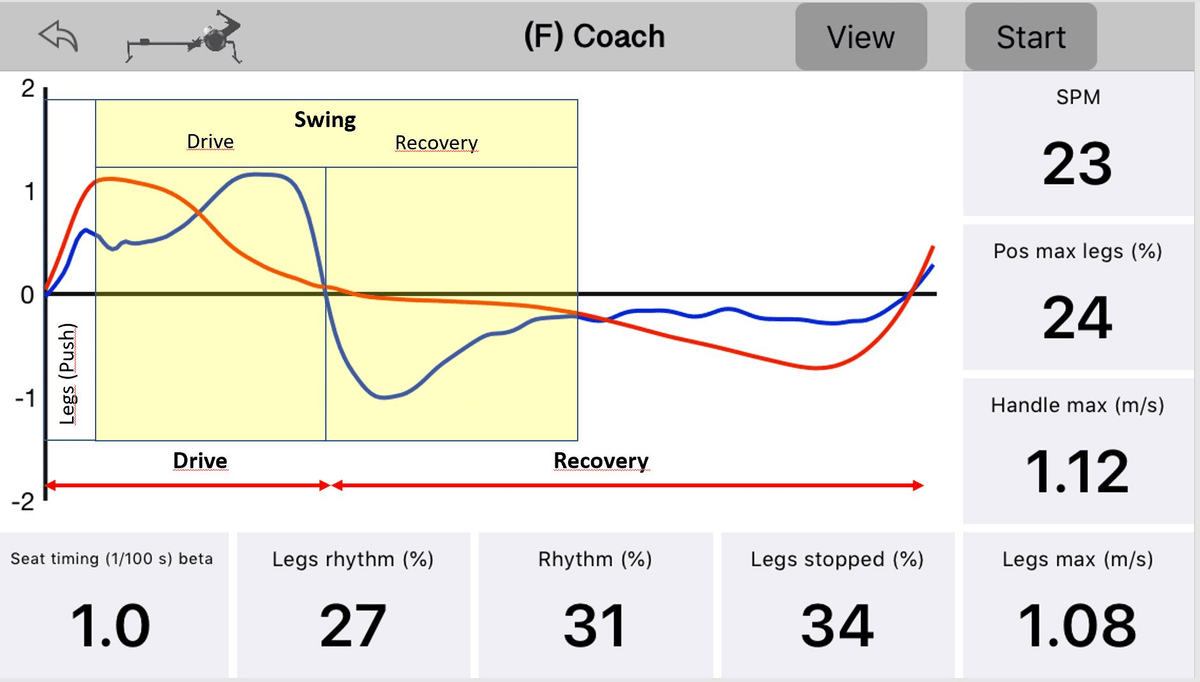
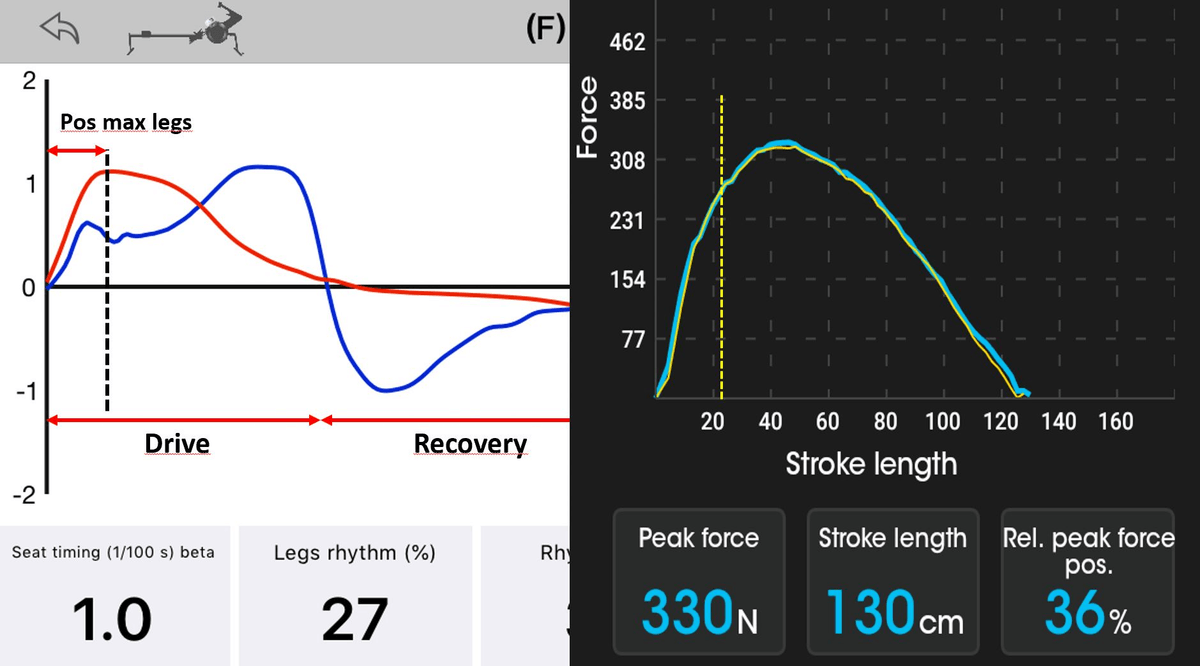
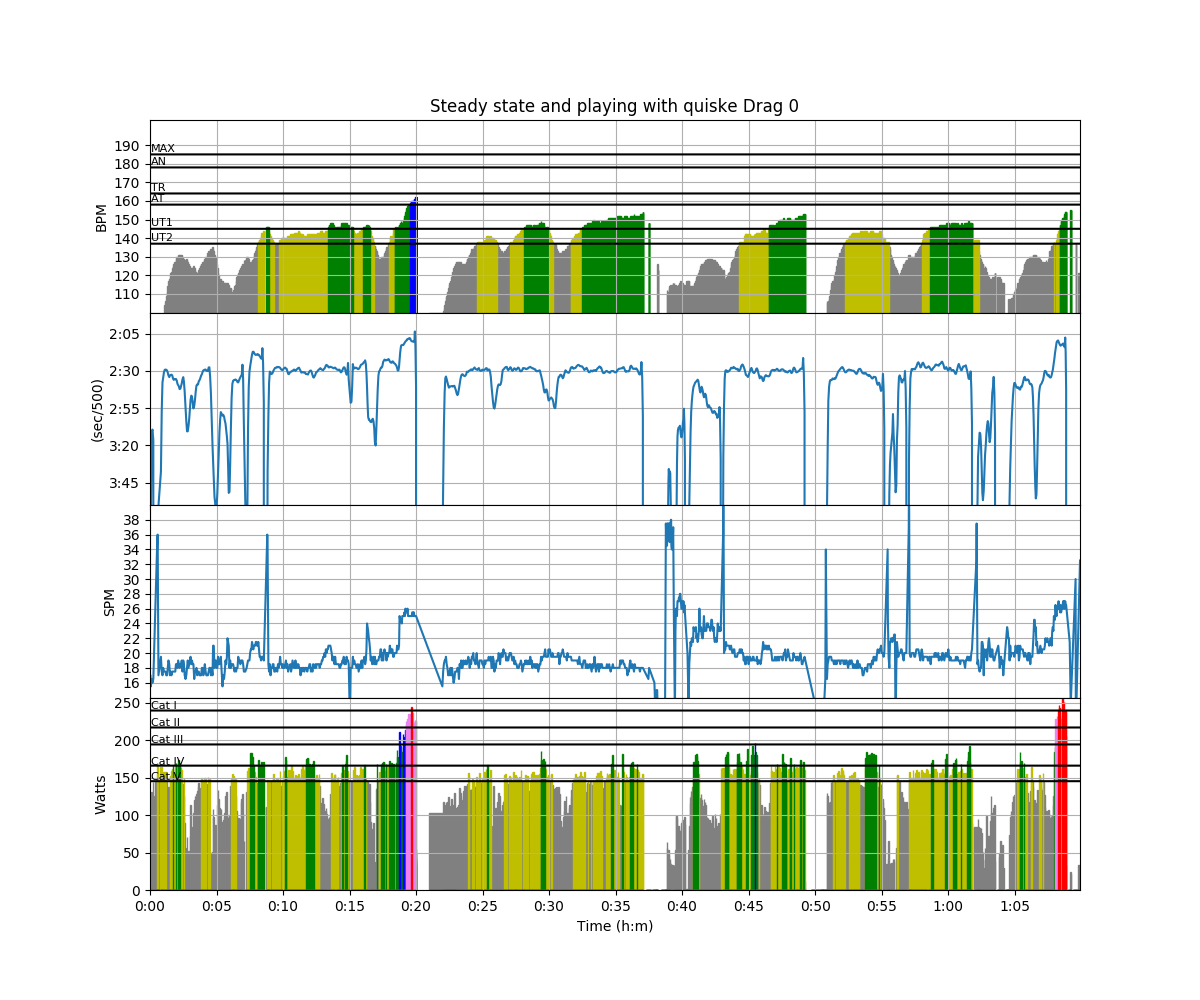
Graphs for the coach extension to openrowingmonitor
quiske
- 
- 
- 
- 
- 
- 
- 
- 
- 
- 
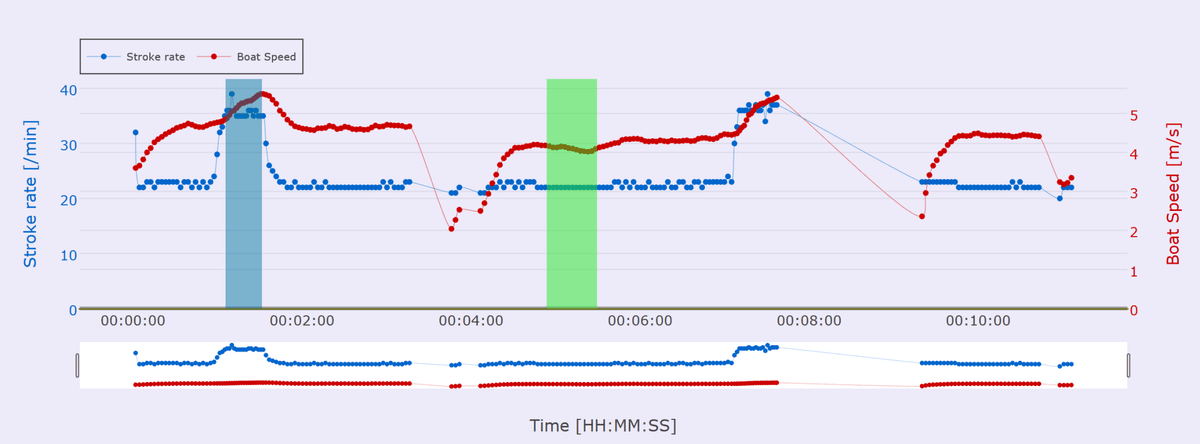
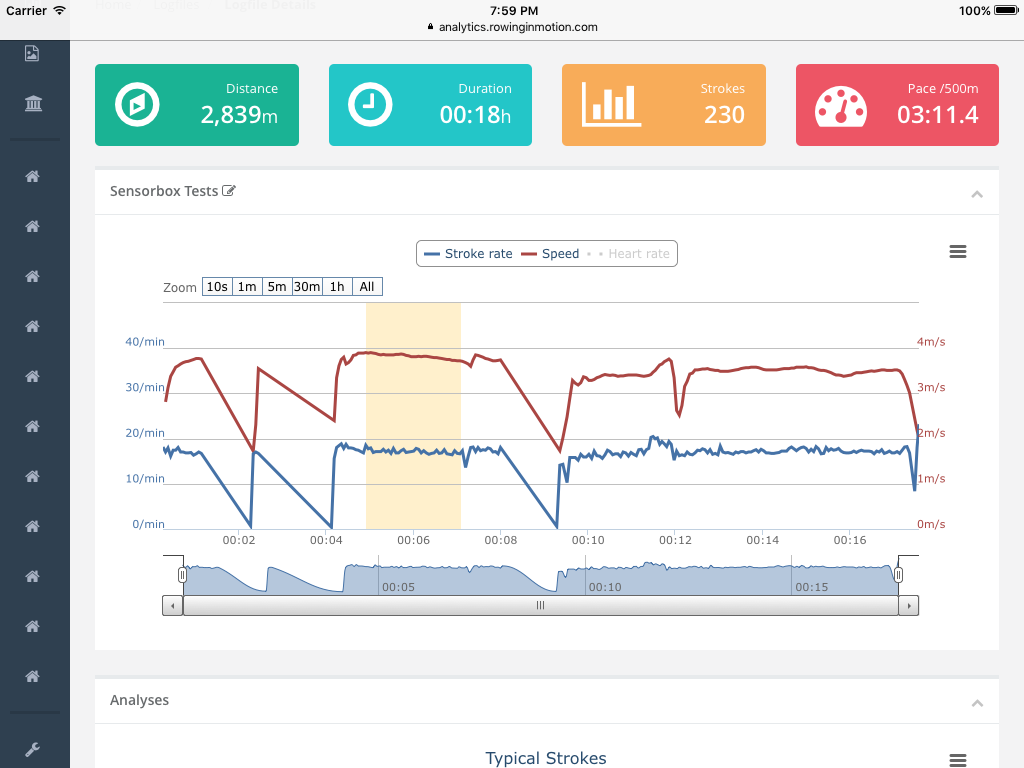
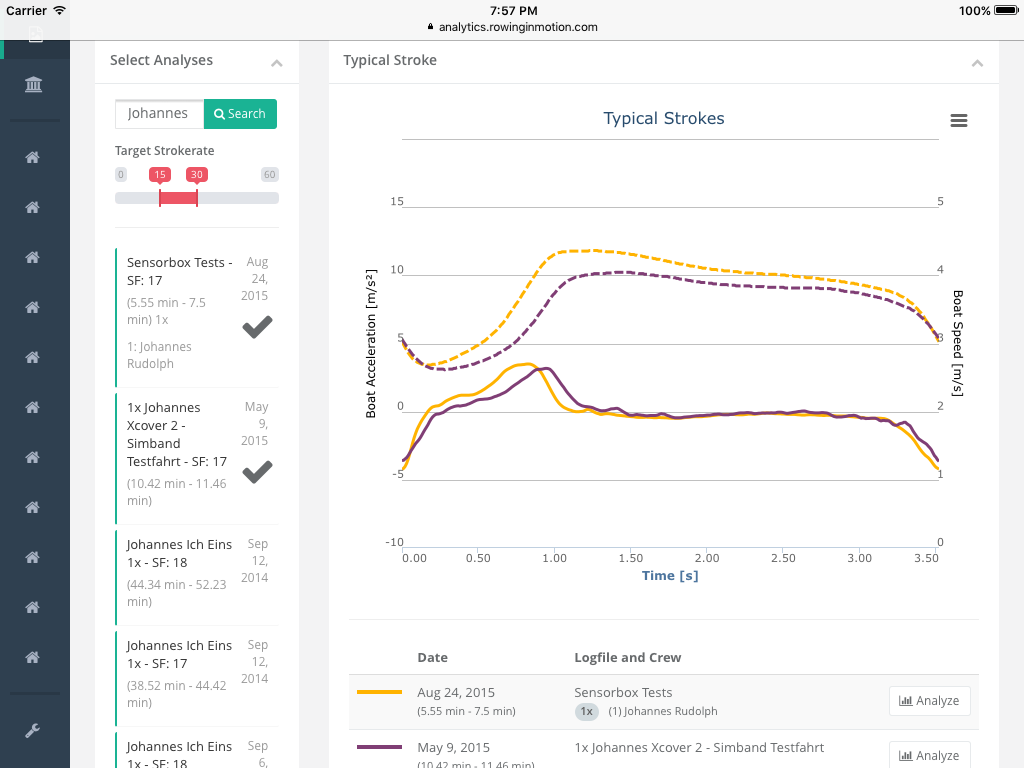
rowing in motion
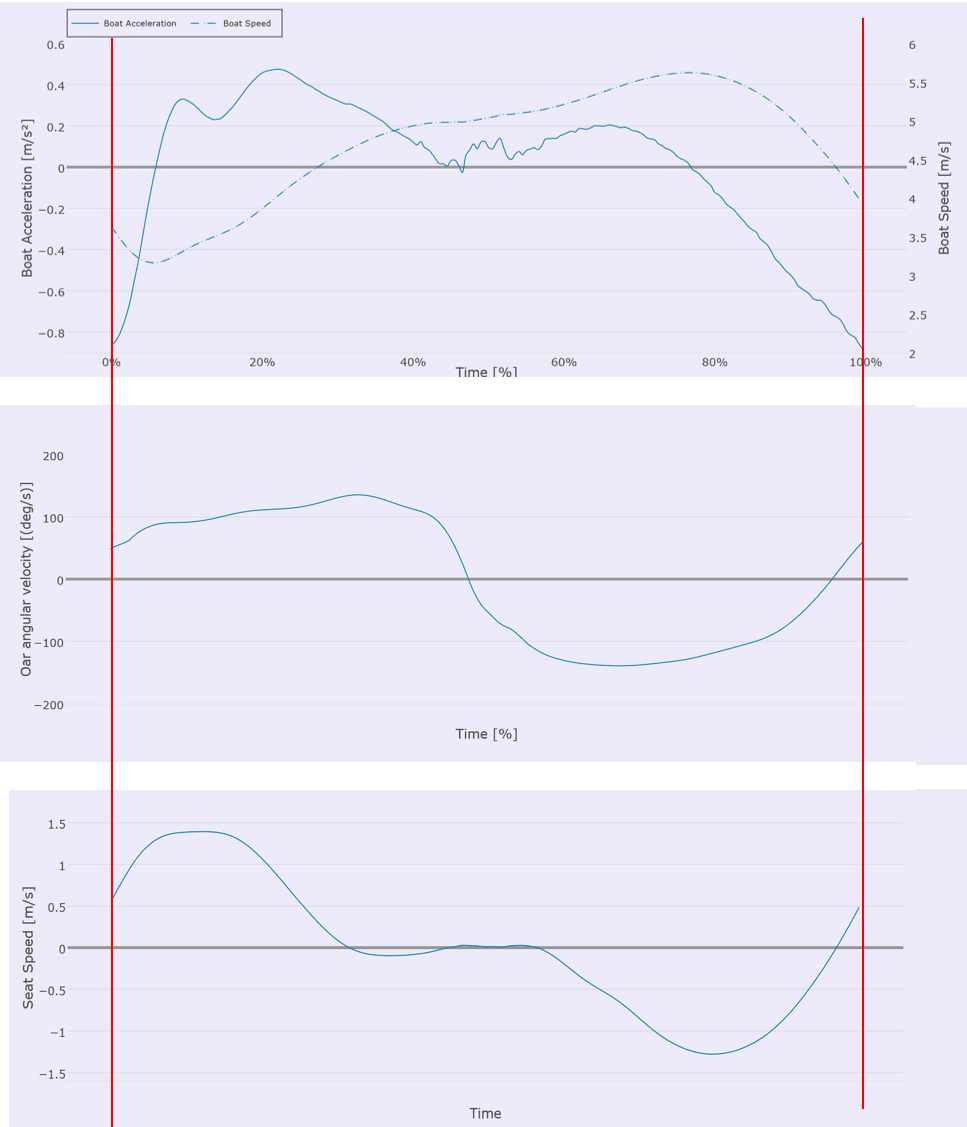
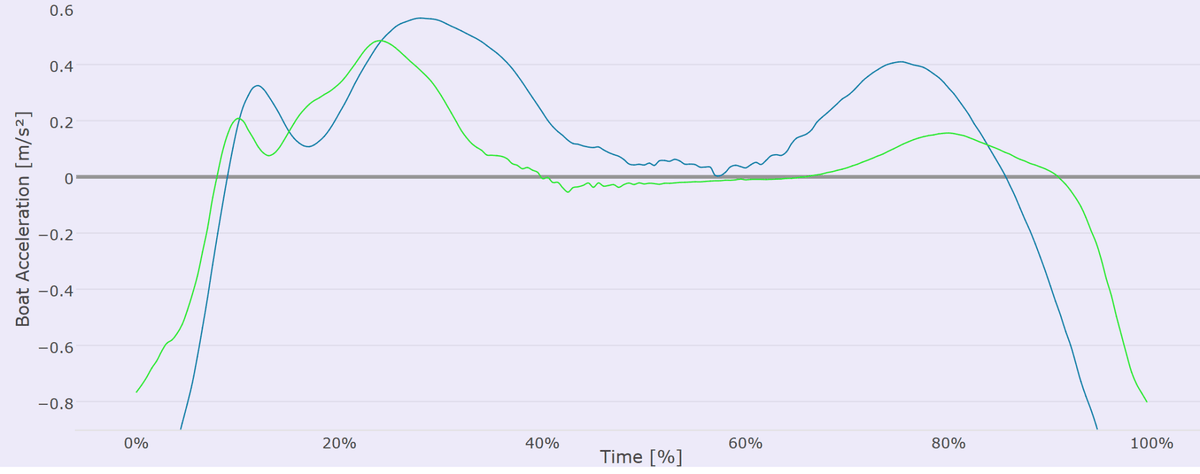
App Metrics
Stoke Effiency
The area under the speed graph.
Catch Duration
The time the boat is decelerating at the catch (sec)
Catch Efficiency
The slope between the point of maximum negative acceleration and the point where zero acceleration was first hit.
Check Factor
The difference between maximum and minimum boat velocity.
stroke analysis
- 
- 
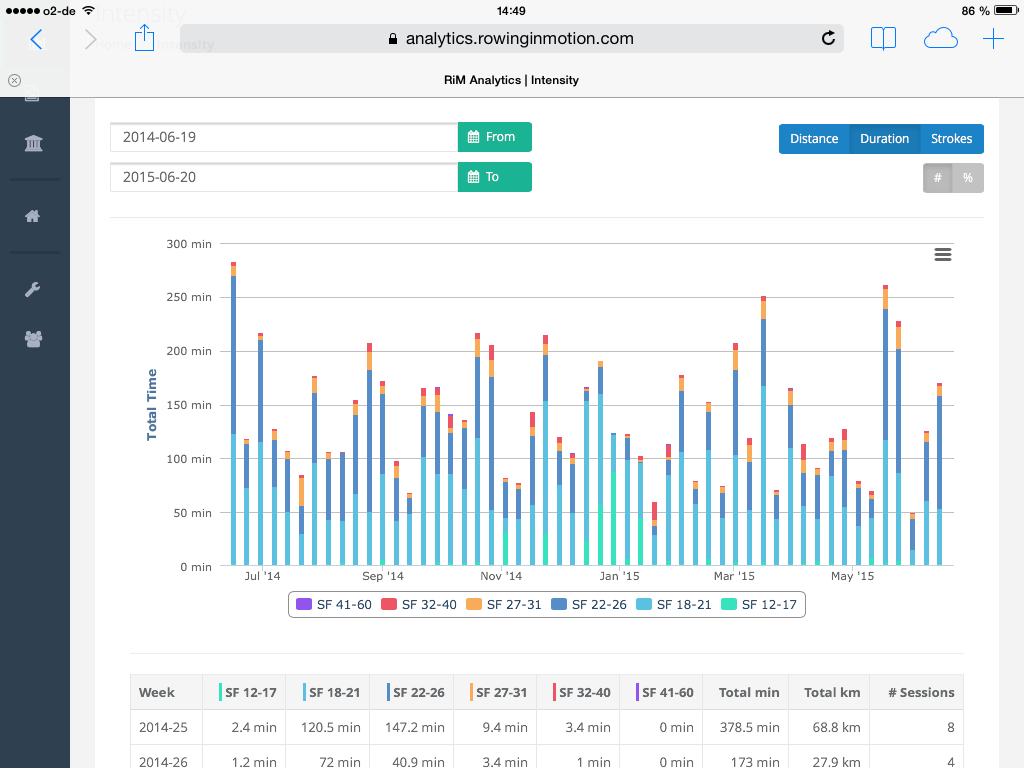
intensity analysis
Intensity histogram donut showing the proportion of each intensity zone to all other intensity zones in a logfile based on either stroke-rate or heart-rate.
- 